Custom Charts
Elevate your data-driven decision-making with our analytics tool's custom charts feature. Tailor visualizations to your precise needs, enabling targeted representation of key metrics and fostering a nuanced understanding of your data.

 Tailored Visualization
- In-Depth Analysis
- Personalized Reporting
HIGHLIGHTS
Increase Conversion Rates
Unlock a world of supplementary features designed to supercharge your analytics experience.

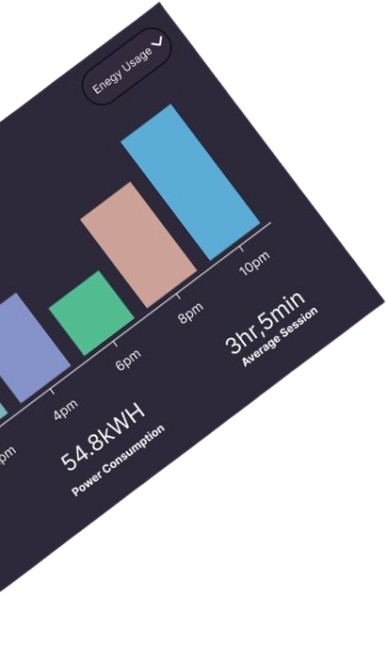
Targeted Data Representation
Custom charts allow users to represent specific data points that are most relevant to their objectives , providing a focused and targeted visualization of key metrics.

Flexible Visualization Options
Users can choose from a variety of visualization options, such as line charts, bar graphs, scatter plots, and more, to match the nature of their data and the insights they wish to convey.

Granular Analysis
Custom charts facilitate granular analysis by allowing users to drill down into specific details, trends, or segments within their data.

Enhanced Reporting Capabilities
Leveraging custom charts enhances reporting capabilities, enabling users to create visual reports that are tailored to their unique requirements.
Ready to get Started ?
Empower your EV charging journey with a software solution built to optimize every connection and drive your success.


Phone
4325-2557-2567
© Copyright 2025 Plugflare.com All rights reserved.